
Before we dive into the spectrum, let's talk about some related everyday ideas. Let's start with music.
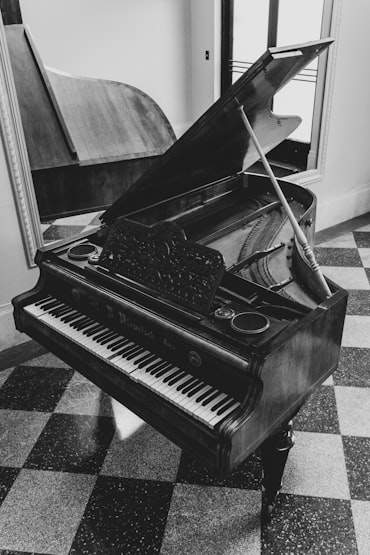
Imagine sitting at a piano. On the left you have the low keys. On the right, you have the high keys. Which keys sounds faster? The high keys on the right. Which keys make a bigger sound? The low keys on the left, which have the bigger strings.
Bigger relates to the amount of space something takes up. Faster relates to how quickly something moves. Little things are easier to move faster.
Let's let those piano ideas percolate in your brain for a minute. While that's happening, let's shift gears and talk about cars.
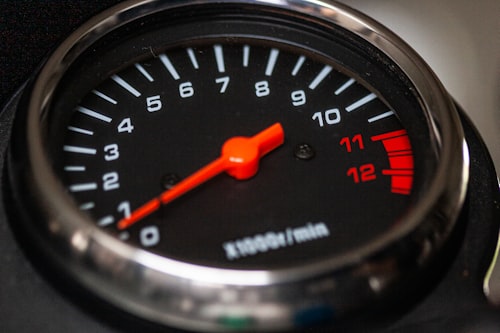
Imagine you're in a race car, waiting for the green flag at the start of the race. You hear the familiar revving of the engine. You can see the tachometer pushing toward the red as the engine making higher and higher pitched noises. That tachometer shows us the RPM - revolutions per minute - that the crankshaft is turning at. The crankshaft is the one of the main things between the engine and wheels, serving as a great indicator of how hard the engine is working.
Now watch the video above (it's loud). This shows the spectrogram plot of the sound of the revving engine. As you hear the engine running faster and faster, the plot spreads wider and wider. The diagonal line furthest to the left is called the fundamental frequency. The fundamental frequency directly relates to the speed of the engine.
So this audio spectrogram plot is a way to visualize what sounds are being made over time. There are lots of audio spectrum visualisation apps, so you can test it out for yourself.
As a more simple example, we can look at the spectrogram of a whistle.
Here we can more easily see the frequency of the whistle versus the engine. Since an engine is a more complex system, there are a lot of sounds, including harmonics.
Let's now go back to the piano for a moment. With a piano we have the same effect, where the keys on the right of the piano create high pitch = high frequency sounds. The keys on the left create low pitch = low frequency sounds. A spectrogram of a piano provides us a direction indication of the keys being played over time.
So with sound, an object moves or vibrates. That motion or vibration wiggles the air around it. That wiggling air makes its way to your ear drum, and your brain perceives the sound. That wiggling air also makes its way to a microphone, which a computer can process to create the spectrogram plot. Then our eyes can look at the plot and we can try to determine what was making that sound, and how it might be moving.
With radio, we have a very similar setup. The first difference is that radio waves are created from electrons moving along an antenna. But you can almost imagine an antenna like a piano string. The longer the antenna, the better it is at making lower frequency signals, just like a long piano string makes a low pitch sound.
The second difference is that sound travels through air, but radio waves travel through the electromagnetic field.
The third difference is that sound is heard by ears and microphones, whereas radio waves are sensed by antennas. Humans don't have radio antennas, so we can't directly sense radio waves. But luckily people have designed antennas, electronics and computers, and those can process the signals to create spectrograms just like we did with sound.
One more difference is that we can only hear sounds with frequencies between about 20 Hz to 20,000 Hz. But the big antennas that are used to receive signals from space can sense frequencies between about 100,000,000 Hz to about 100,000,000,000 Hz. With that many zeros, it's time for Mega and Giga. 100,000,000 Hz is 100 Mega Hz, or 100 MHz for short. 100,000,000,000 Hz is 100 Giga Hz, or 100 GHz for short. Those frequencies of 100 MHz to 100 GHz cover essentially the entire range of every modern form of wireless communication on Earth and beyond.
Hopefully this helps get you going. You can check out Spectrum Display Overview to learn more about how to interact and understand Radwave's plots.
One important thing to note when you're using Radwave: if you find some weird signal, but have no clue what it is, you can still tag it and share it. The hard part with looking for neato signals is finding signals in the first place. Signals come in all shapes and sizes, and nobody knows what might be coming from what out in space. If you point something out though, someone else can always investigate it further. You pointing it out could really be the difference maker. And you don't need any experience to point stuff out.